11.5.5. Viewing the results
To view the results make the “nominal” task active by selecting one of its items in the Design tasks tree and choosing Task/View results from the main menu. The results database can be viewed while the task is running. Whenever a new result is stored in the database the results tree is updated.
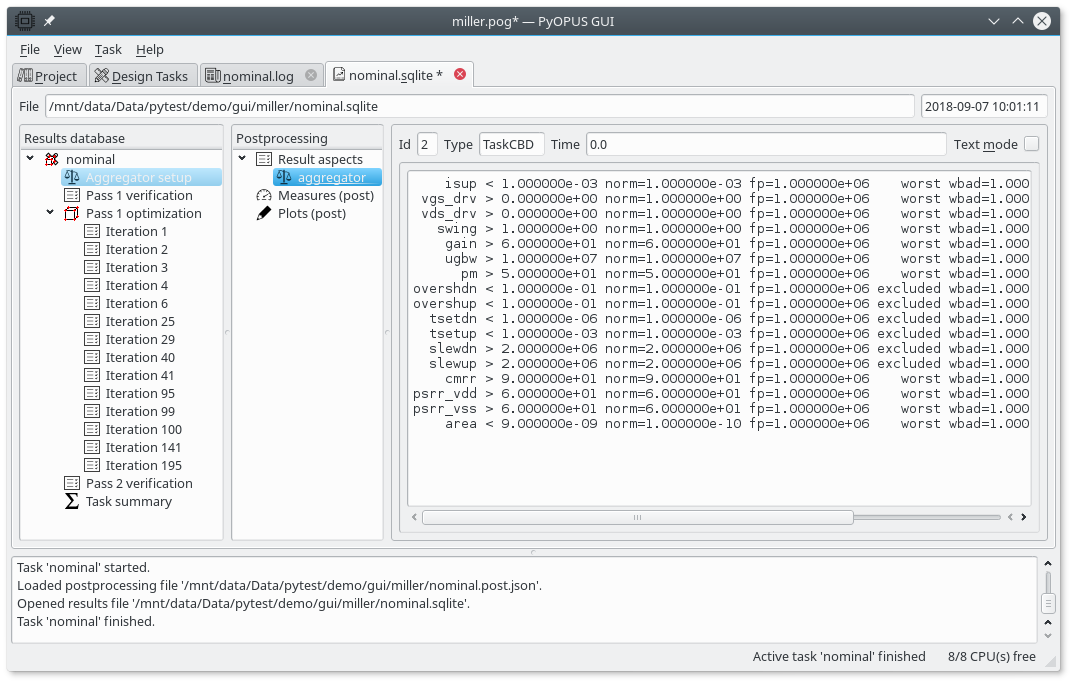
Results tab displaying the aggregator setup.
The aggregator setup node contains information on how the cost function is computed from the performance measure values. For every design requirement the norm, (norm), failure penalty (fp), type of contribution (i.e. worst value across corners, excluded), contribution weight for measures not satisfying design requirements (wbad), and the contrbution weight for measures satisfying design requirements (wgood).
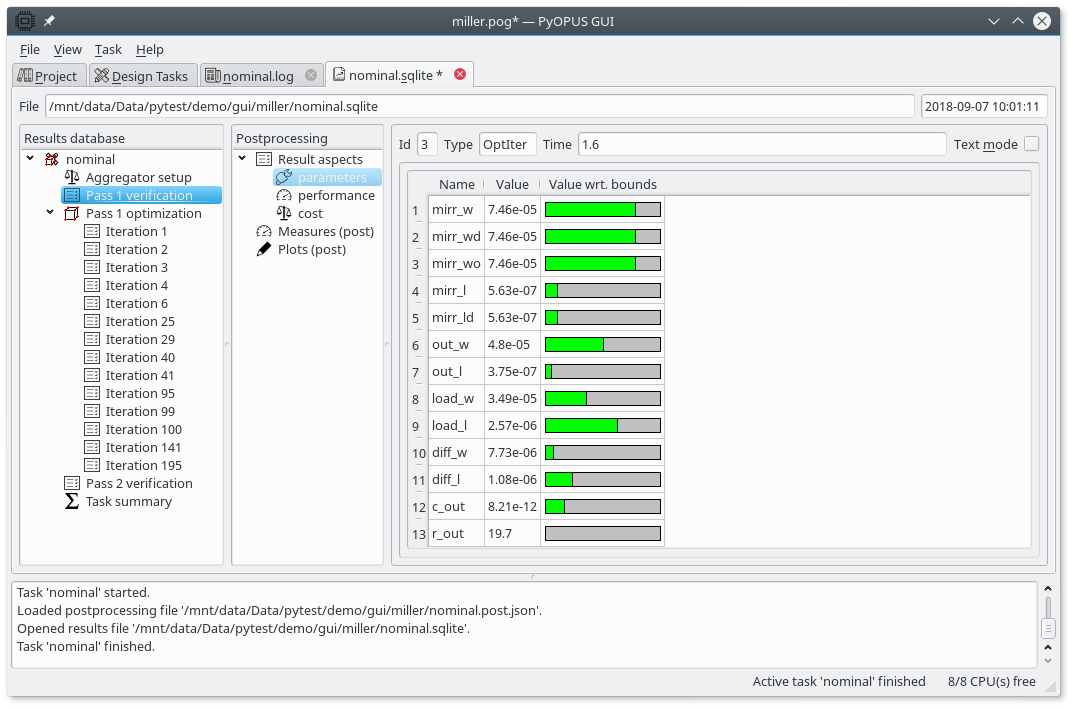
Results tab displaying the parameter values used in the initial circuit evaluation.
The design parameter values can be viewed for all verification and optimization iteration nodes. Select the “parameters” aspect in the Postprocessing tree.
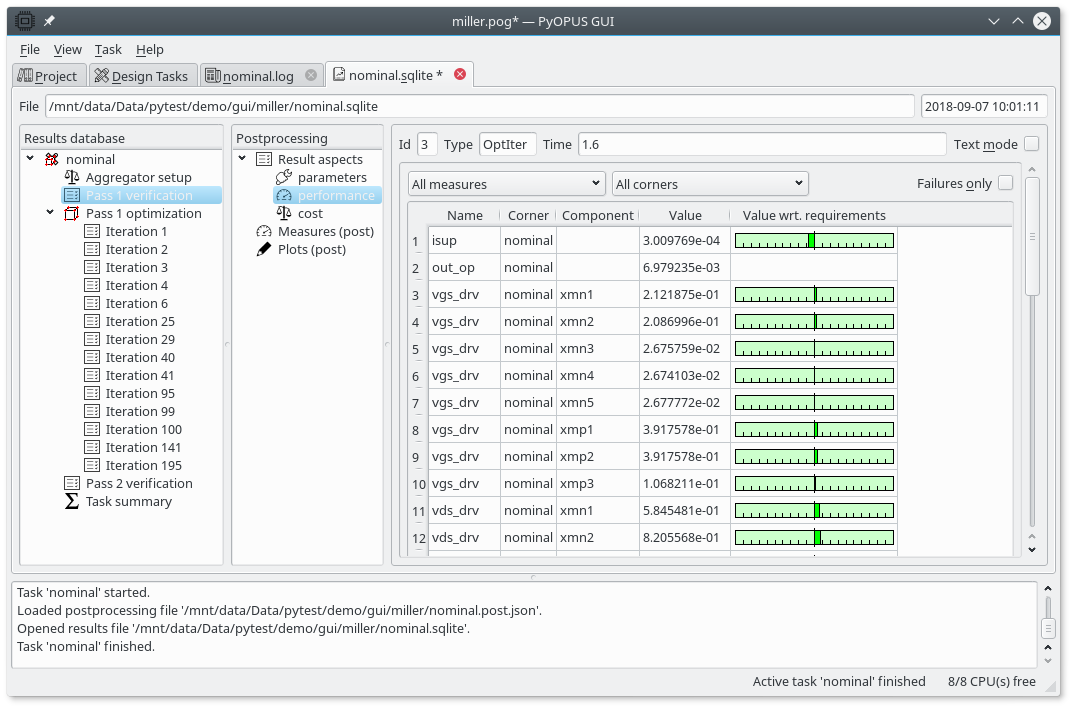
Results tab displaying the performance of the initial circuit.
To display the values of the performance measures select the “performance” aspect in the Postprocessing tree. For vector-values measures the vector’s components are printed separately. The name of a component is in the “component” column of the table. The results can be filtered by performance measure and corner name. If you check “Failures only” only those performance measure-corner-component entries will be printed that fail to satisfy the design requirements.
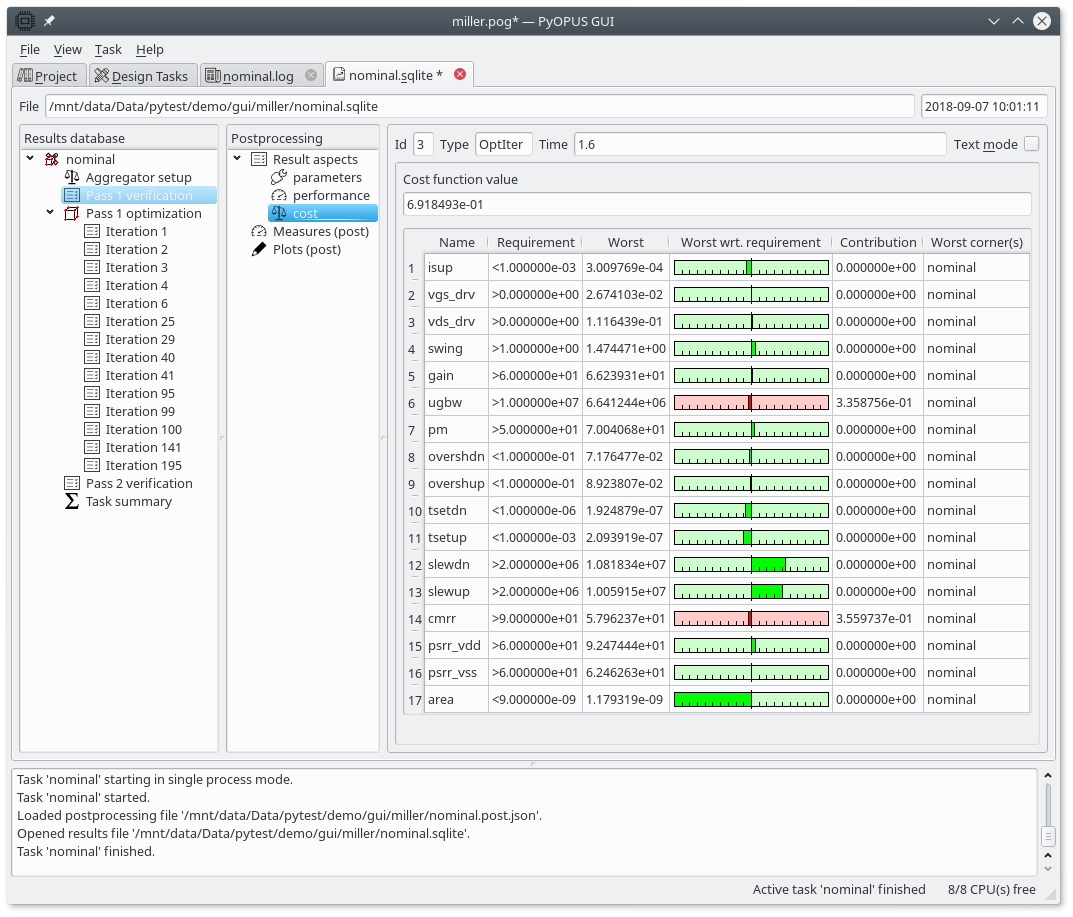
Results tab displaying the cost function composition of the initial circuit.
The cost function composition is obtained by selecting the “cost” aspect in the Postprocessing tree. Every design requirement (i.e. above/below) is displayed in one row of the table. For every performance measure its worst value with respect to the design requirement is printed along with the cost function contribution and the corner where the worst value is observed.
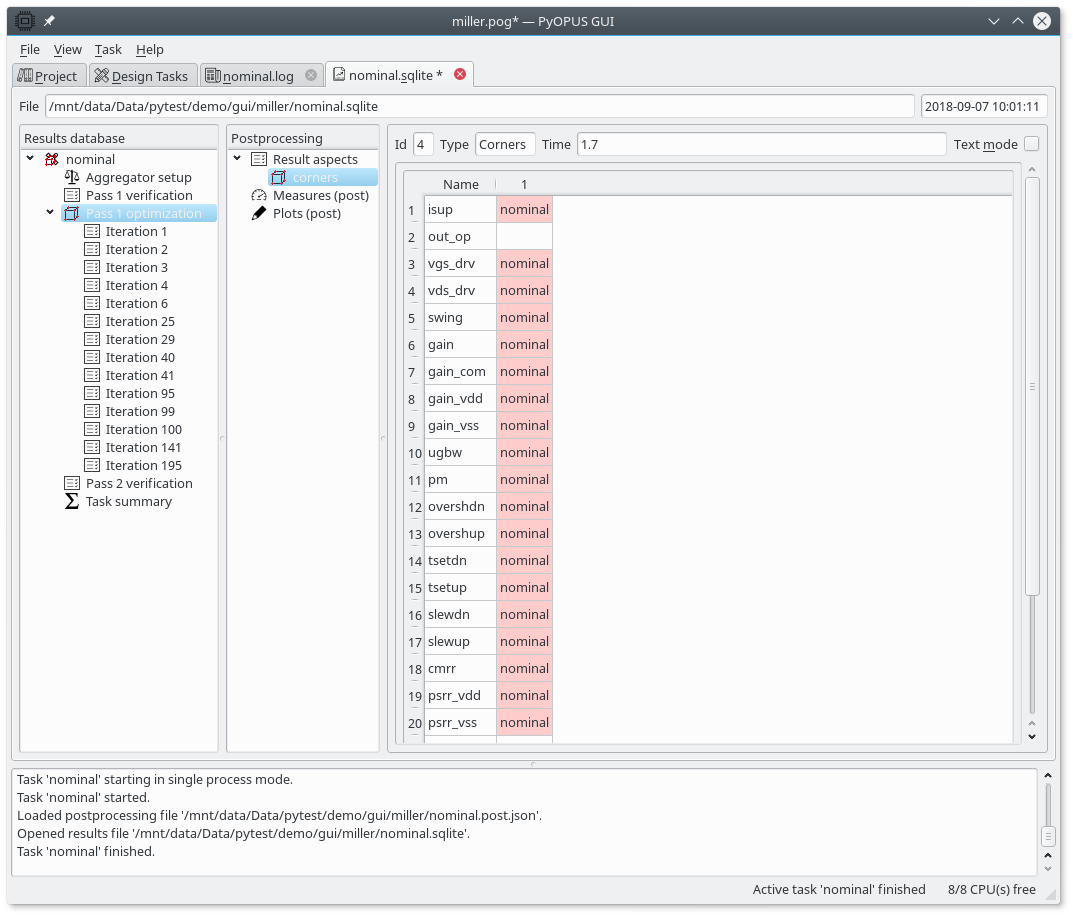
Results tab displaying the corners for which the performance measures will be evaluated in an optimization run.
Every optimization run (pass) starts with an evaluation across all corners followed by a node holding the lists of corners for which individual performance measures will be evaluated during the optimization run. Corner that are freshly added in this pass are colored red.
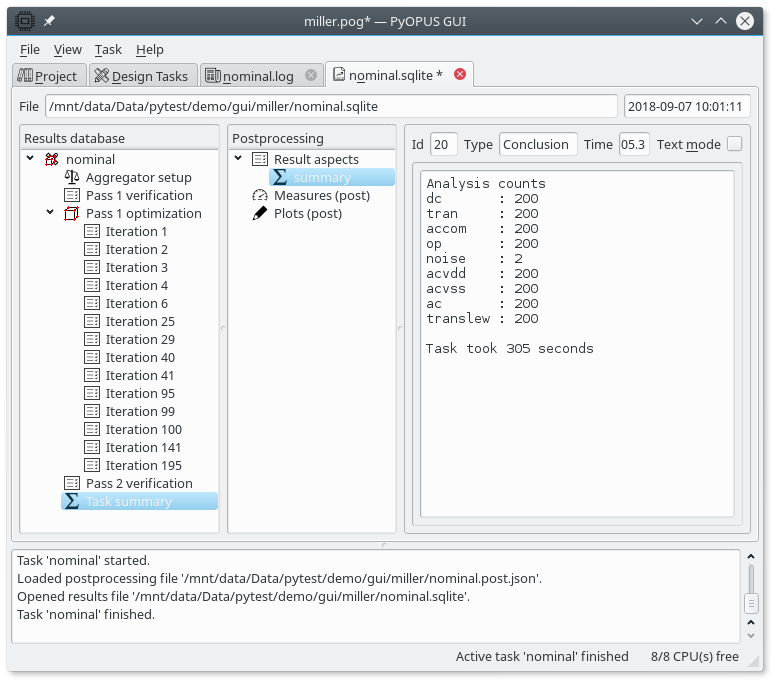
Results tab displaying the summary of the task.
In the end a summary node is added to the results database. The summary node lists the number of times each analysis was performed along with the time it took the task to finish.
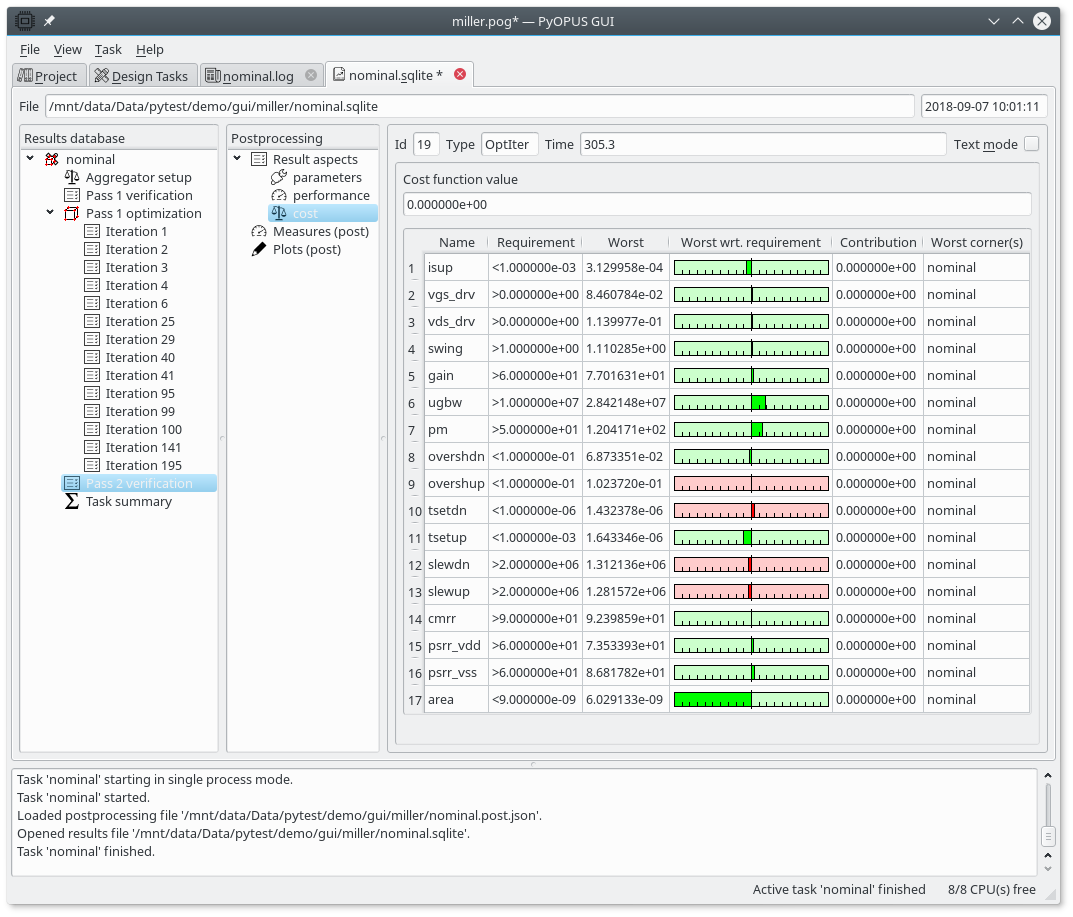
Results tab displaying the cost function composition of the final circuit.
If you open the final verification result node you can inspect the properties of the circuit that was found by the optimizer. Note that some performance measures are colored red (i.e. overshdn, overshup, slewdn, and slewup). This is because a design requirement is specified for them but they are not included in the cost function. Therefore the optimizer did not try to satisfy the corresponding design requirements.