Screenshots
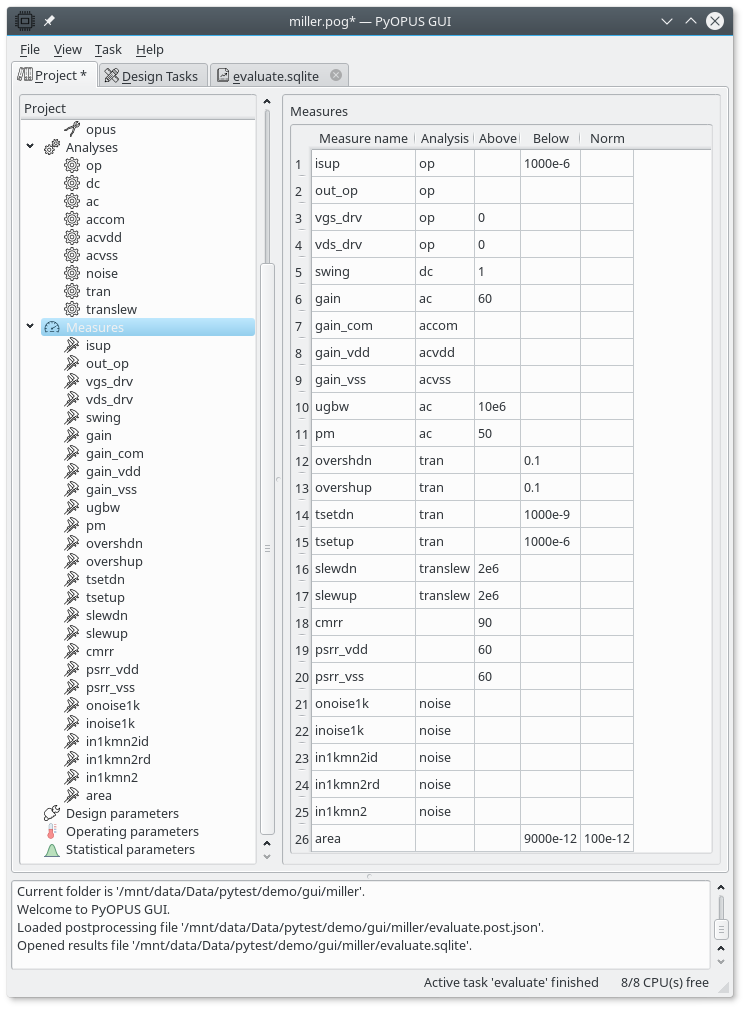
Setting up performance measures in the design automation GUI.

Setting up a cluster of workstations for parallel processing.
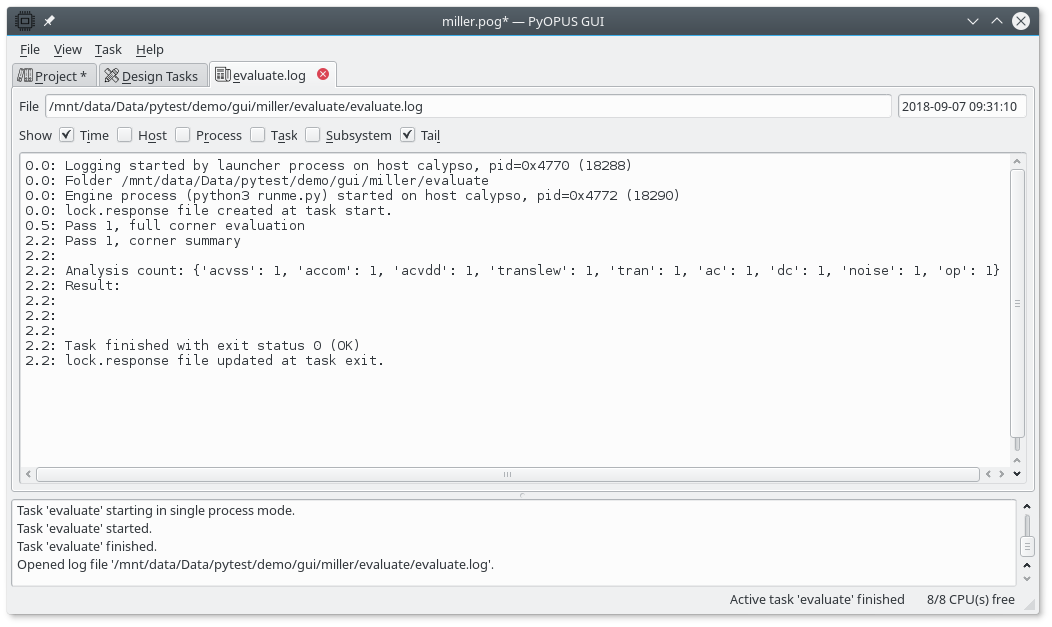
Viewing the log file.
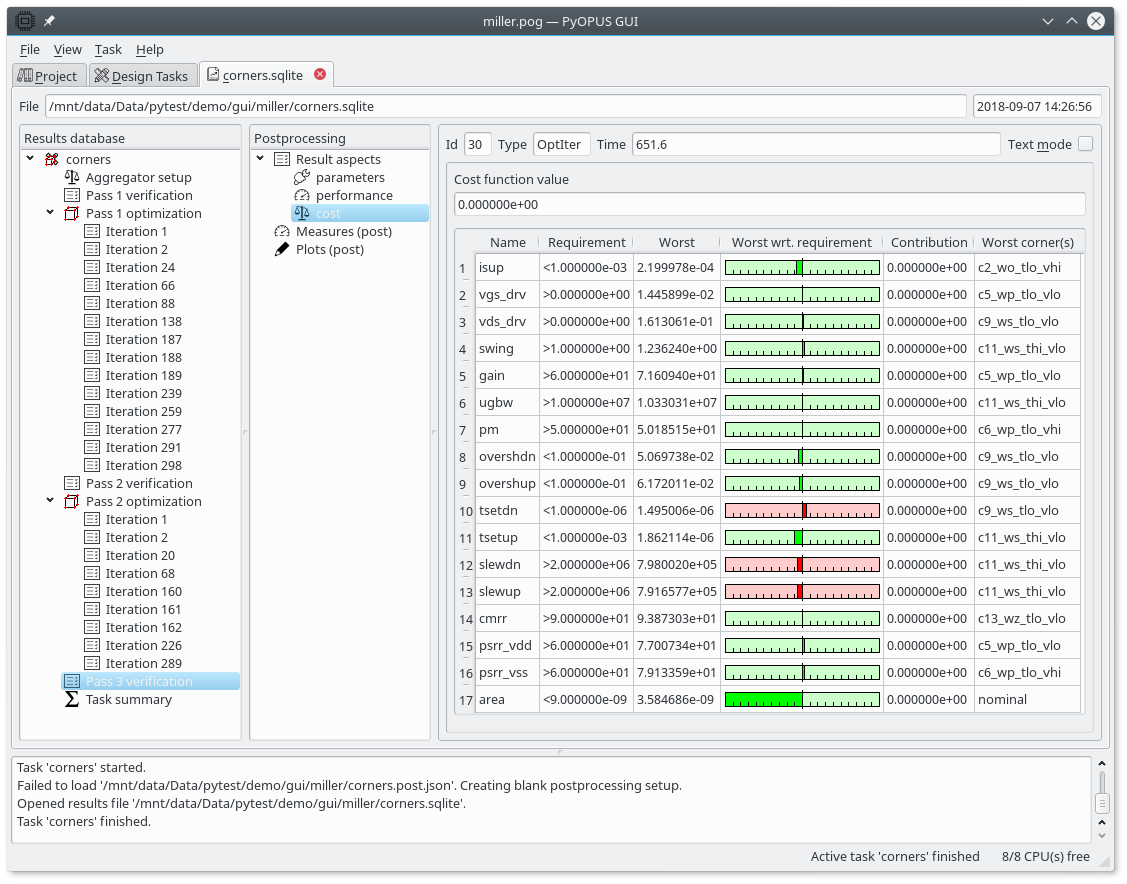
Viewing the performance of the circuit obtained by the GUI.

Viewing the values of design parameters.
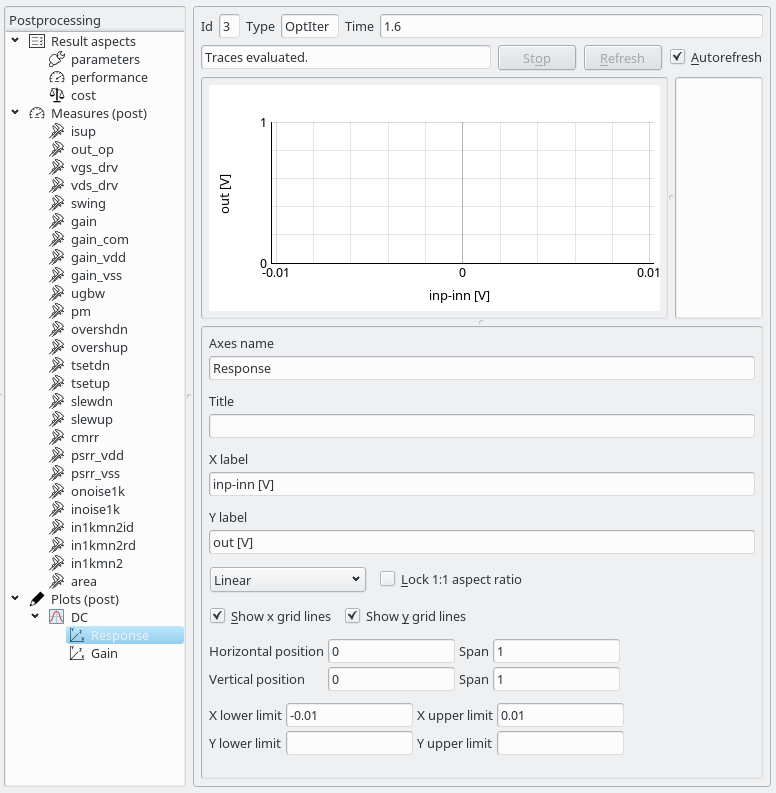
Setting up a waveform plot in the GUI.
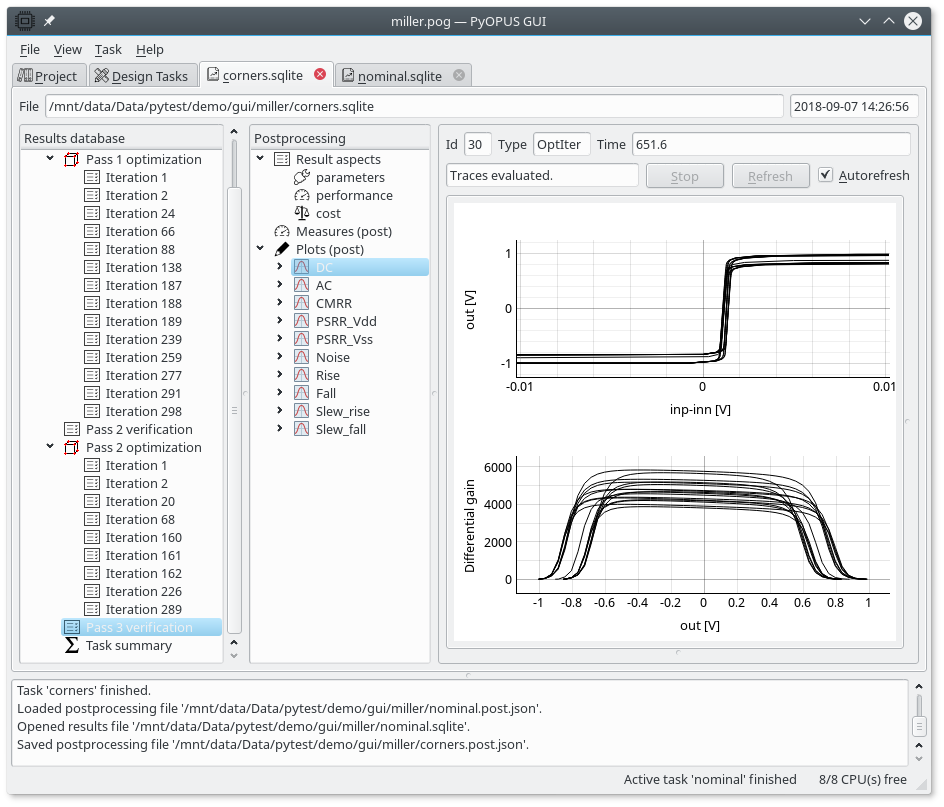
Plotting the circuit's response across multiple corners.
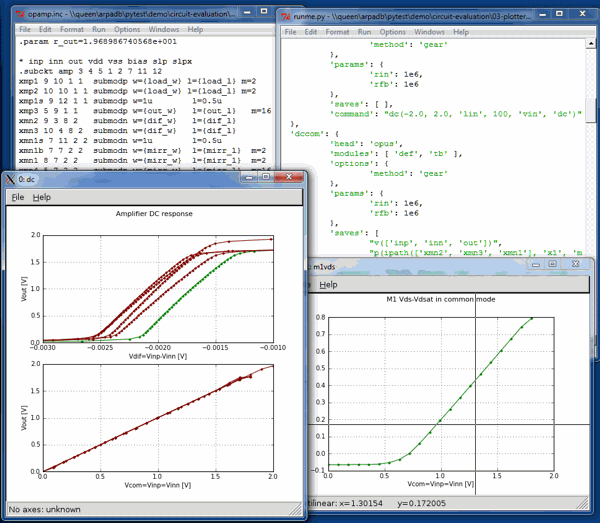
PyOPUS library for Windows optimizing a circuit and visualizing the results with
MatPlotLib.
News :
- 2026-01-14
PyOPUS 0.12 released - 2024-08-26
PyOPUS 0.11.2 released - 2023-08-23
PyOPUS 0.11.1 released - 2023-06-01
PyOPUS 0.11 released - 2022-04-21
PyOPUS 0.10 released - 2018-09-10
PyOPUS 0.9 released - 2015-07-10
PyOPUS 0.8 released - 2012-12-04
PyOPUS 0.7 released - 2012-03-12
Windows Quickstart - 2011-10-15
PyOPUS 0.6 released
Links :
(c) 2008-2026 Árpád Bűrmen
EDA Laboratory
Faculty of Electrical Engineering
University of Ljubljana
Maintained by Árpád Bűrmen
Design by Minimalistic Design
EDA Laboratory
Faculty of Electrical Engineering
University of Ljubljana
Maintained by Árpád Bűrmen
Design by Minimalistic Design