11.3.5. Using the log file for debugging
If your run fails to produce results you can find the error by enabling the debugging options of various modules in PyOPUS and then observing the messages they print in the log file.
Suppose your netlist for the top level circuit topdc.inc incorrectly
specifies the load resistance so that it depends on an undefined parameter
rx instead of rload.
rl1 (net001 0) r={rx}
This will result in an error in the simulator module because we did not
define rx. By default debugging is disabled for all modules except
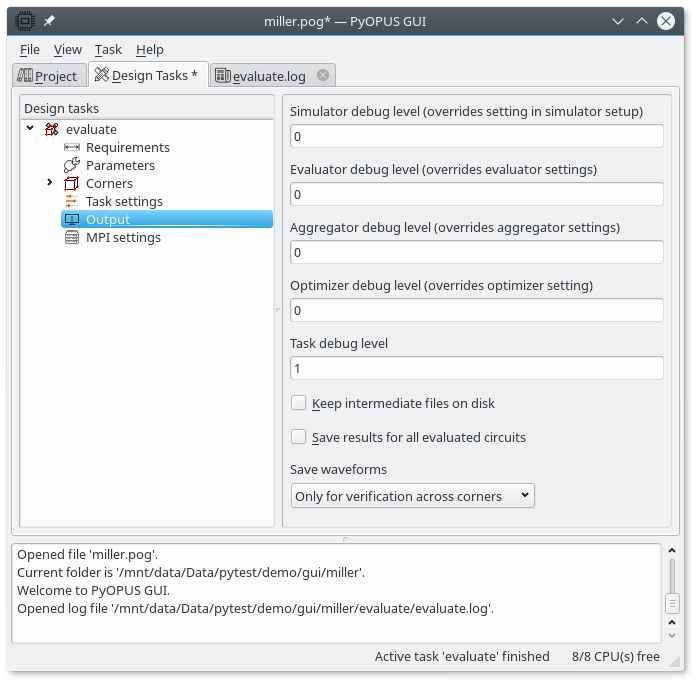
for the design task you are running. To set the debug options select the
Output tree entry in the Design tasks tree.

The output settings of a task.
The first five settings specify the debug level of various PyOPUS modules. Level zero means no debug messages. Higher levels mean more verbose output. To debug the simulator with all its messages set the “Simulator debug level” to 3 or higher. Level 2 will print only the last few lines of the simulator’s output and level 1 prints only progress messages.
After you set the debug level run the task again and look at the log. Display the Subsystem name for log messages and you will get something like this.
0.0 LNCH: Logging started by launcher process on host calypso, pid=0x809 (2057)
0.0 LNCH: Folder /mnt/data/Data/pytest/demo/gui/01-simple/evaluate
0.0 LNCH: Engine process (python3 runme.py) started on host calypso, pid=0x80b (2059)
0.0 LNCH: lock.response file created at task start.
0.5 CBD : Pass 1, full corner evaluation
0.5 SOSI: Writing job group '0' to file 'calypso_80b_1_0_group0.cir'
0.5 SOSI:   job 'CnominalAtranslew'
0.5 SOSI: Cleaning up result for job group 0
0.5 SOSI: Running file 'calypso_80b_1_0_group0.cir'
1.2 SOSI: Loading analog.cm
1.2 SOSI: analog.cm, version 1.0 $Revision: 216 $, Oct 17 2017
1.2 SOSI: Analog system-level simulation library.
1.2 SOSI: Author: GTRI, portions written by Arpad Buermen
1.2 SOSI: Copyright: (c)2000
1.2 SOSI: Found 19 CM device(s) and 0 UDN(s).
1.2 SOSI: Successfully loaded 19 CM device(s) and 0 UDN(s).
We can see that the first four messages come from the laouncher module
(LNCH). The fifth message comes from the CBD module (which handles
evaluation and design across corners). The remaining messages are from the
Spice Opus simulator module (SOSI). The actual netlist for the simulator
was written to file calypso_80b_1_0_group0.cir. This file was used
for running job CnominalAtranslew which corresponds to translew
analysis in corner nominal. The file is run by the Spice Opus
simulator and the messages from time 1.2 on are generated by the simulator.
Now let us skip to the part when the actual file processed by the simulator.
1.2 SOSI: University of Ljubljana, Slovenia
1.2 SOSI: Faculty of Electrical Engineering
1.2 SOSI: Group For Computer Aided Circuit Design
1.2 SOSI: http://www.spiceopus.si
1.2 SOSI:
1.2 SOSI: Error: rx: no such vector.
1.2 SOSI: Arithmetic substitution in:
1.2 SOSI:   rl1 (net001 0) r={rx}
1.2 SOSI: at expression no. 1 failed. Reason:
1.2 SOSI:   failed to parse the expression
1.2 SOSI: Module: top level circuit
1.2 SOSI:   rl1 (net001 0) r={rx}
1.2 SOSI:   arithmetic substitution failed
1.2 SOSI:   in file topdc.inc on line 26
1.2 SOSI:   included from calypso_80b_1_0_group0.cir on line 53
1.2 SOSI:
1.2 SOSI: Error encountered while parsing the circuit.
1.2 SOSI: Starting .control block in spite of errors.
1.2 SOSI: Running CnominalAtranslew
1.2 SOSI: SpiceOpus (c)-2.32 $Revision: 216 $ done
1.2 SOSI:
1.2 SOSI: Reading results from 'calypso_80b_1_0_job0_CnominalAtranslew.raw'.
1.2 SOSI: Job 'CnominalAtranslew' OK
We can clearly see that the simulator complains about an undefined
parameter rx. The simulation is started regardless of this error and
the waveforms are saved. Therefore the job is considered to be successfull
by PyOPUS although the resulting waveforms are meaningless since resistor
rl1 is missing from the circuit.
There are several other debug settings available in the task’s output settings.
Evaluator debug level specifies the debug level for the evaluator module. If you have problems with computing perfoemance measures this is the place where you should look for an error.
Aggreagtor debug level is for debugging the aggregator module. This module computes the aggregate cost function value from the circuit’s performance measures. Because this module is pretty simple in most cases the cause of your problems will be somewhere else.
Optimizer debug level is for debugging optimization algorithms. This is meant for developers. Normal users normally do not need to turn on debugging for this module.
Task debug level is for diplaying messages generated by the design task. By default is is set to 1 so that you can monitor the progress of the task in the log file.
If you turn on the “Keep intermediate files on disk” the simulator input files will not be deleted from the disk after the analysis is completed. The remaining settings will be explained in later sections.