10.1.2. Adding axes and traces to plot windows
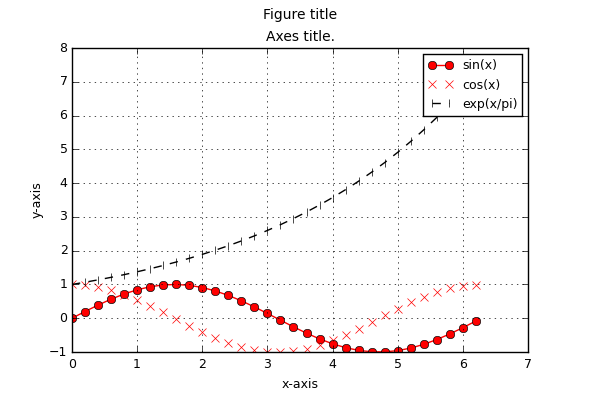
First the MatPlotLib GUI must be locked. This disables refreshing and avoids race conditions between threads. After verifying that the plot window is still there (if it is not, API calls will crash) the axes and the traces are added using the MatPlotLib API. In the end the figure is drawn and the GUI is unlocked.
Make sure that all the arrays you plot (and all other data) is accessed only by MatPlotLib after it has been plotted. If you are not sure, pass a copy of the data to the API calls (so that after plotting you can still mess around with the original data without crashing the GUI).
File 02-axes-traces.py in folder demo/plotting/
from pyopus.plotter import interface as pyopl
from numpy import arange, sin, cos, exp, pi, e

if __name__ == '__main__':
	# Plot data - sin(x), cos(x), exp(x/pi) .. for x in [0, 2pi] with 0.2 step.
	x = arange(0.0, 2*pi, 0.2)
	y1 = sin(x)
	y2 = cos(x)
	y3 = exp(x/pi)

	# Create first figure (plot window). This is now the active figure.
	f1=pyopl.figure(windowTitle="Figure - single axes", figpx=(600,400), dpi=100)

	# Lock GUI
	pyopl.lock(True)

	# Check if figure is alive
	if pyopl.alive(f1):
		# Create axes that will take a 76% x 76% area of the figure.
		# The bottom left corner of the axes is at 12% of figure height and
		# width measured from the bottom left corner of the figure.
		ax1=f1.add_axes((0.12,0.12,0.76,0.76))

		# Add first trace (x, y1).
		# Solid line, points marked with o.
		# Color is a (r,g,b) tuple.
		# Label it 'sin(x)'.
		# See matplotlib for style options.
		ax1.plot(x, y1, '-o', label='sin(x)', color=(1,0,0))

		# Add second trace.
		# Red, points marked with x, no line.
		ax1.plot(x, y2, 'rx', label='cos(x)')

		# Add third trace
		# Dashed, black, points marked with vertical lines.
		ax1.plot(x, y3, '--k|', label='exp(x/pi)')

		# Add legend.
		ax1.legend()

		# Label axes, add title.
		ax1.set_xlabel('x-axis')
		ax1.set_ylabel('y-axis')
		ax1.set_title('Axes title. ')

		# Turn on grid.
		ax1.grid(True)

		# Figure title.
		f1.suptitle("Figure title")

		# Draw figure on screen
		pyopl.draw(f1)

	# Unlock GUI
	pyopl.lock(False)

	# Wait for the control window to be closed
	pyopl.join()
