11.3.4. Viewing the log file
When the task is started the Python script produces a bunch of messages
that can be used for monitoring the progress of the task, as well as
debugging. The log file is named evaluate.log and is stored in the
task’s folder. It is a text file. You can view the log file of the active
task by selecting Task/View log in the main menu. A log tab is opened
displaying the contents of the log file.

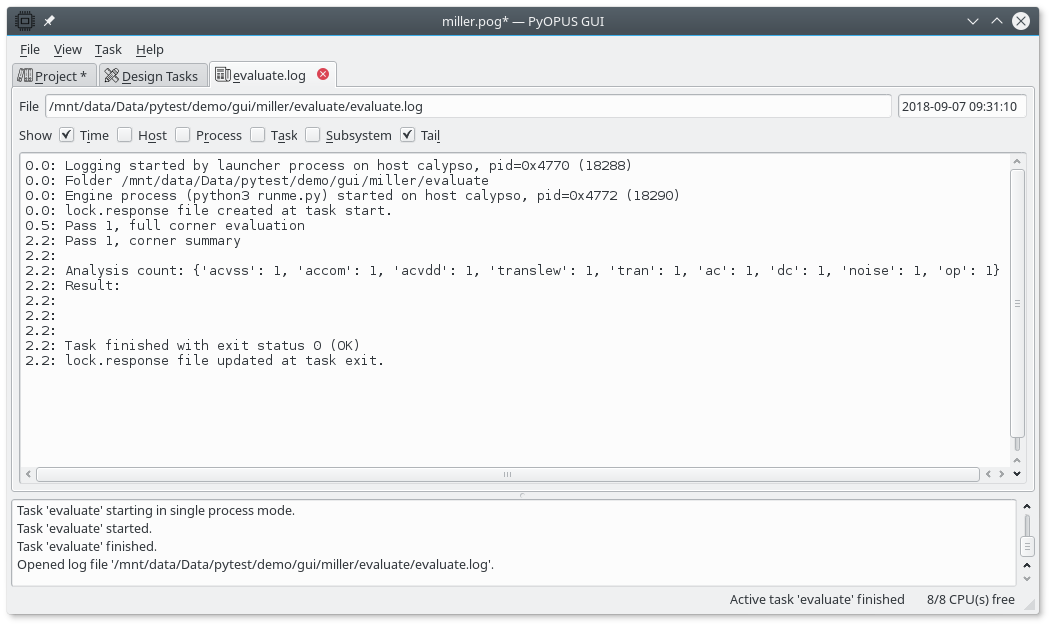
The log viewer tab displaying a log file.
The log viewer is capable of updating itself when new entries are added to the log. The log jumps to its last line when a new entry is detected if the “Tail” checkbox is checked.
The top of the log tab displays the path to the log file and the timepoint when the log was started (first entry). below are checkboxes for displaying various information on the log entries.
“Time” displays the time in seconds measured from the log start when the log entry was added
“Host” displays the hostname of the host where the process that created the log entry was running
“Process” displays the ID of the process that created the log entry. This ID is unique on one host, but can be identical for two processes running on different hosts.
“Task” displays the ID of the microthread that generated the log entry. This ID is unique within one process. Two microthreads that belong to two different processes can have the same ID.
“Subsystem” displays the PyOPUS subsystem name where the log entry was generated.
Now let us take a closer look at the log entries.
0.0: Logging started by launcher process on host calypso, pid=0x4e73 (20083)
0.0: Folder /mnt/data/Data/pytest/demo/gui/01-simple/evaluate
0.0: Engine process (python3 runme.py) started on host calypso, pid=0x4e75 (20085)
0.0: lock.response file created at task start.
We can see that first a process (launcher) was started. The path to the task’s
folder is printed and the engine process that runs the runme.py script is
started. This is marked in the lock.response file.
0.5: Pass 1, full corner evaluation
2.1: Pass 1, corner summary
2.1:
2.1: Analysis count: {'noise': 1, 'ac': 1, 'dc': 1, 'accom': 1, 'tran': 1, 'acvdd': 1, 'acvss' 1, 'translew': 1, 'op': 1}
2.1: Result:
2.1:
The task is then started. It evaluates the circuit across all corner-analysis
pairs. Because no performance measures are defined the corner summary is
empty. In the end the number of times each analysis was performed is printed.
Because we defined no perfomance measures the Result is empty. Finally
the message that the task is completed is printed and the lock.response
file is updated to reflect that the task is finished.
2.2: Task finished with exit status 0 (OK)
2.2: lock.response file updated at task exit.