10.1.10. 3D plots
File 10-3d.py in folder demo/plotting/
from pyopus.plotter import interface as pyopl
from numpy import arange, sin, cos, exp, pi, e, linspace, outer, ones, size
if __name__ == '__main__':
# Plot data - sin(x), cos(x), exp(x/pi) .. for x in [0, 2pi] with 0.2 step.
x = arange(0.0, 2*pi, 0.2)
y1 = sin(x)
y2 = cos(x)
y3 = exp(x/pi)
# Create first figure (plot window). This is now the active figure.
# Tag is assigned automatically by the system.
f1=pyopl.figure(windowTitle="Figure - single axes", figpx=(600,400), dpi=100)
# Lock the main GUI event loop. This implicitly disables repainting.
pyopl.lock(True)
# If the window is closed the C++ part of the object is deleted,
# but the PyQt wrapper is still around. Accessing any attribute then
# results in an exception. To check if the C++ part is still there, call
# the alive() function with figure as argument.
if pyopl.alive(f1):
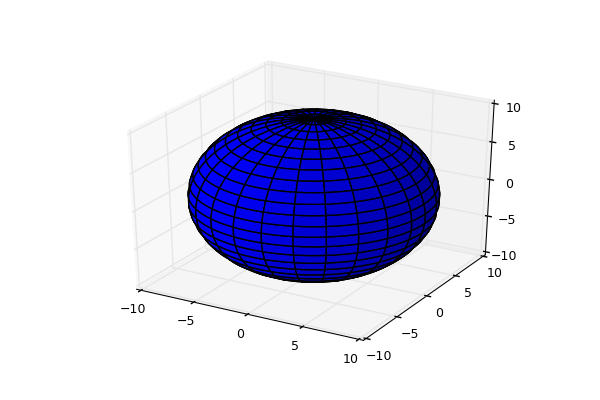
ax = f1.add_subplot(1, 1, 1, projection='3d')
u = linspace(0, 2 * pi, 100)
v = linspace(0, pi, 100)
x = 10 * outer(cos(u), sin(v))
y = 10 * outer(sin(u), sin(v))
z = 10 * outer(ones(size(u)), cos(v))
ax.plot_surface(x, y, z, rstride=4, cstride=4, color='b')
# Paint the changes on the screen.
pyopl.draw(f1)
# Now unlock the main GUI event loop
pyopl.lock(False)
# Wait for the control window to be closed
pyopl.join()