10.1.8. Annotating plots
File 08-grid-annotations.py in folder demo/plotting/
import pyopus.plotter as pyopl
from numpy import arange, sin, cos, exp, pi, e
if __name__ == '__main__':
# Initialize gui thread, clean up.
pyopl.init()
pyopl.close()
# Plot data - sin(x), cos(x), exp(x/pi) .. for x in [0, 2pi] with 0.2 step.
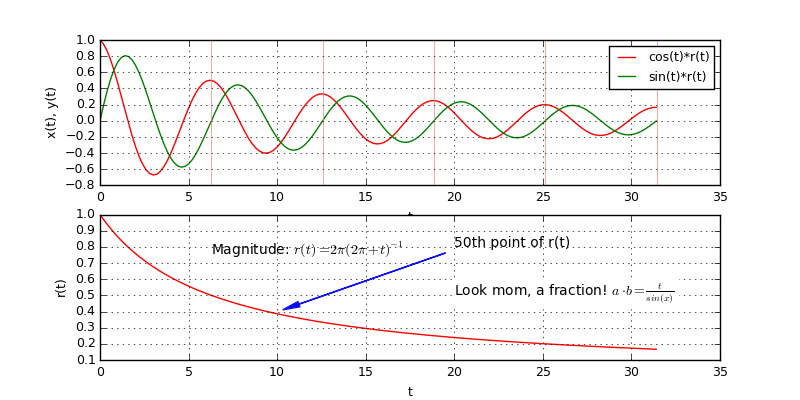
t = arange(0.0, 10*pi, 0.2)
r = 2*pi/(2*pi+t)
y = sin(t)*r
x = cos(t)*r
# Plot window
f1=pyopl.figure(windowTitle="Annotations", figpx=(800,400), dpi=100)
# Lock GUI
pyopl.lock(True)
# Check if figure is alive
if pyopl.alive(f1):
# Create 2 subplots, horizontal stack of 2
ax1=f1.add_subplot(2,1,1)
ax2=f1.add_subplot(2,1,2)
# First axes
ax1.plot(t, x, '-', label='cos(t)*r(t)', color=(1,0,0))
ax1.plot(t, y, '-', label='sin(t)*r(t)', color=(0,0.5,0))
ax1.grid(True)
ax1.set_xlabel('t')
ax1.set_ylabel('x(t), y(t)')
ax1.legend()
# Add manual x grid lines
ax1.axvline(2*pi, color=(1,0.5,0.5), linewidth=0.5)
ax1.axvline(4*pi, color=(1,0.5,0.5), linewidth=0.5)
ax1.axvline(6*pi, color=(1,0.5,0.5), linewidth=0.5)
ax1.axvline(8*pi, color=(1,0.5,0.5), linewidth=0.5)
ax1.axvline(10*pi, color=(1,0.5,0.5), linewidth=0.5)
# Second axes
ax2.plot(t, r, '-', label='r=r(t)', color=(1,0,0))
ax2.grid(True)
ax2.set_xlabel('t')
ax2.set_ylabel('r(t)')
# Add text, x and y coordinates are in scale units
# Backslashes in LaTeX markup must be escaped (double backslashes)
ax2.text(20, 0.5, 'Look mom, a fraction! $a \\cdot b = \\frac{t}{sin(x)}$', backgroundcolor=(1,1,1))
ax2.text(2*pi, 0.75, 'Magnitude: $r(t)=2\\pi(2\\pi+t)^{-1}$')
# Add annotation with arrow
# First point is the arrowhead point.
# Second point is the text position.
ax2.annotate('50th point of r(t)', (t[49], r[49]), (20.0, 0.8),
arrowprops={'width': 0.1, 'shrink': 0.05, 'headwidth': 4, 'edgecolor': '#1010ff', 'facecolor': '#0000ff'}
)
# Draw figure on screen
pyopl.draw(f1)
# Unlock GUI
pyopl.lock(False)
# Handle keyboard interrupts properly.
pyopl.join()