7.1. pyopus.plotter.plotwidget — PyQt5 canvas for displaying Matplotlib plots
PyQt canvas for displaying Matplotlib plots
This module provides a PyQt canvas for Matplotlib to render its plots on. The canvas supports zooming and displays cursor position in axes coordinates as the cursor moves across the canvas.
A plot window is an object of the QWidget class. The canvas itself
is an object of the PlotPanel class.
The module also provides saving of the plots to raster (e.g. PNG) or vector files (e.g. Postscript).
-
class
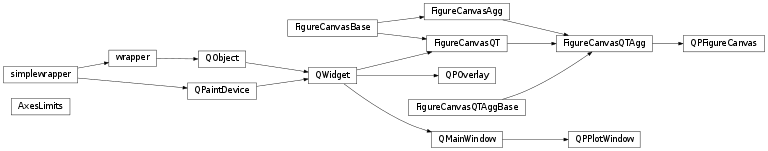
pyopus.plotter.plotwidget.QPPlotWindow(parent=None, title='Plot window', lock=None, **kwargs)¶ A matplotlib canvas embedded in a PyQt window.
For parent see PyQt documentation.
title is the title of the window. See PyQt documentation for parent and id.
lock is a
threading.Lockobject that prevents other threads from accessing Matplotlib objects while PyQt events are handled. It is passed to theQPFigureCanvasobject.All remaining arguments are passed to the
QPFigureCanvasconstructor.-
closeEvent(e)¶ Just before the window is closed this handler is invoked. It emits a
windowClosingsignal.
-
createActions()¶ Creates menu actions.
-
createStatusBar()¶ Creates a statu sbar at the bottom of the window.
-
draw()¶ Draw the associated
Figureonto the screen. Shortcut to theQPFigureCanvas.draw()method.
-
getCanvas()¶ Returns the
QPFigureCanvasobject associated with this window.
-
getFigure()¶ Returns the MatPlotLib
Figureassociated with this canvas.
-
onAbout()¶ Handles the Help/About option.
-
onClose()¶ Handles the File/Close option.
-
onCloseAll()¶ Handles the File/Close all windows option.
-
onFileSave()¶ Handles File/Save option.
-
updateCoordinates(data)¶ Updates the coordinates display in status bar.
-
windowClosing¶ This signal is emitted when the user requests closing of all plot windows.
-
-
class
pyopus.plotter.plotwidget.QPFigureCanvas(parent=None, lock=None, showCrosshair=True, showRubberband=True, pointEvents=True, selectionEvents=True, zooming=True, figpx=None, figsize=None, dpi=None)¶ A Matplotlib canvas suitable for embedding in PyQt5 applications.
For parent see PyQt documentation.
lock is a
threading.Lockobject for preventing other threads from accessing gui data while the gui thread uses them.Setting showCrosshair and showRubberband to
Trueenables the corresponding facilities of the canvas.By setting point and selection to
Truethe canvas emitsPointEvent(SelectionEvent) events whenever crosshair position (rubberband) is changed.Setting zooming to
Trueenables zooming.figsize is a tuple specifying the figure width and height in inches. Together with dpi they define the size of the figure in pixels.
figpx is a tuple with the horizontal and vertical size of the figure in pixels. If it is given it overrides the figsize setting. dpi is used for obtaining the figure size in inches.
If neither figsize nor figpx are given the settings from matplotlibrc are used. The same holds for dpi.
Holding down the left button and moving the mouse selects the area to be zoomed. The zooming is performed when the button is released.
Right-clicking zooms out to the previous view.
Pressing the
Ikey identifies the nearest curve and shows a tooltip.-
emitCoordinates(event)¶ Extracts coordinate information and emits a
newCoordinatessignal.
-
enableCoordinatesEvents(state)¶ Enable or disable emitting
newCoordinatessignal.
-
enablePicking(axes, width=8)¶ Enables picking for all artists under given axes.
-
enableSelectionEvents(state)¶ Enable or disable
newSelectionsignal.
-
enableZooming(state)¶ Enable or disable zooming in/out when the user makes an area selection or right-clicks the axes.
-
getFigure()¶ Returns the MatPlotLib
Figureassociated with this canvas.
-
newCoordinates¶ Signal that gets emitted every time rubberband is changed
A handler for matplotlib
button_press_eventevents. Invoked every time a mouse button is pressed.
A handler for matplotlib
button_release_eventevents. Invoked every time a mouse button is released.
-
on_key_press_event(event)¶ A handler for matplotlib
key_press_eventevents. Invoked every time a key is pressed.If
Iis pressed pickign is enabled for all artists and a pick event is generated at cursor position.
-
on_motion_notify_event(event)¶ A handler for matplotlib
motion_notify_eventevents. Invoked every time mouse moves across the canvas or when a mouse button is released.
-
on_pick_event(event)¶ A handler for matplotlib
pick_eventevents. Invoked every time user picks a location close to some object.
-
set_repaint(state)¶ Enable or disable repainting.
-
showCrosshair(state)¶ Enable or disable drawing crosshair when mouse cursor moves inside a matplotlib axes.
-
showRubberband(state)¶ Enable or disable rubberband drawing.
-
-
class
pyopus.plotter.plotwidget.QPOverlay(parent=None, enableCrosshair=True, enableRubberband=True)¶ A transparent Qt widget that overlays crosshair and rubberband.
-
keyPressEvent(event)¶ Key press event handler. Ignores the events so they get sent to the parent widget (the one that is under the overlay).
-
paintEvent(event)¶ Repaints the overlay.
-
setCrosshair(pos)¶ Set crosshair position pos (a tuple holding x,y coordinates). It is assumed y coordinate is inverted (increasing from bottom to top of the widget).
Ip pos is set to
Nonecrosshair is not displayed.Calling this function schedules an update of the overlay.
-
setRubberband(pos0=None, pos=None)¶ Set rubberband to be a rectangle between pos0 and pos. Both positions are tuples holding x,y coordinates. It is assumed y coordinate is inverted (increasing from bottom to top of the widget).
Ip pos0 or pos is set to
Nonerubberband is not displayed.Calling this function schedules an update of the overlay.
-
showCrosshair(state)¶ Enable/disable crosshair.
-
showRubberband(state)¶ Enable/disable rubberband.
-